Forward
Here’s a simple idea to learn for families and friends, and some wisdom to share:
Sometimes, insurance policies change while they’re still active. New exclusions or limitations can be added through updates and endorsements, and many people never fully realize what changed until they need to file a claim.
The result is painful: people keep paying higher premiums, believing they have one level of protection, only to find out later that coverage is narrower than they thought.
You’re not alone. Across America, families and business owners are feeling the same pressure — premiums rising year after year, while everyday costs keep climbing. That’s exactly why we created a company that works only for you, the consumer.
Insurance companies are built to manage risk and protect their bottom line. They have actuaries, legal teams, and advanced analytics working for them. Most people don’t have the time — or the tools — to track policy changes, compare options, and understand what those changes mean in real life.
That’s where we come in.
My Policy Advocate™ doesn’t sell insurance and we don’t take commissions. We work for you — with a low annual subscription designed to help you stay informed, monitor changes, and feel confident about your protection throughout the year.
We believe this should be a national conversation — and it should be front and center.
Year-round protection. Real people. Real follow-through.
We monitor your personal and commercial policies, surface important changes, and support you with live Advocacy Reps when you need help.
When you want a real person, we’re here. Call our live Advocacy Reps toll-free at 1-800-641-7672. We’ll answer your questions, help you get set up, and stay with you through onboarding. No bots or automated menus—just friendly people who make sure you feel supported from start to finish.
Get the coverage you actually need (and stop paying for coverage you don’t)
Insurance should protect you the way you expect it to. But policies can change over time — endorsements get added, limits shift, exclusions appear — and most people don’t see it until there’s a problem.
My Policy Advocate helps you see what you have, what changed, and what you may want to fix — so you can shop with confidence.
How it works
1) Start with your current policy: This is the contract you agreed to. If you don’t have it handy, your agent or broker can send it to you as a PDF.
2) Upload the key documents:
- Your full policy
- Your Declarations Page (especially for Homeowners, Renters, and Auto)
- Any endorsements, exclusions, renewal packets, or notices you’ve received while the policy has been active
3) Get a clear policy analysis. Your My Policy Analysis highlights:
- Coverage gaps
- Exclusions that may limit protection
- Limits that may be too low for your needs
- Any changes that may have reduced coverage over time
Important: You can be paying full premiums even when your coverage isn’t what it used to be — which can increase the chance of a claim being challenged or denied.
4) Compare what you signed to what you have now. We help you compare the policy you originally agreed to with the version currently in force, so changes are easy to spot.
5) Ask for three competitive quotes (based on what matters) Take the “Most Important Missing Items” from your analysis and ask your agent to quote three options that include the protections you want.
We also send:
- Premium notices 30 days in advance
- Renewal notices 60 days in advance
So you have time to shop without pressure.
6) Upload your quotes for side-by-side review
We’ll review the quotes and flag anything that’s missing, weak, or not a fit — so you can ask for adjustments or better options.
7) Choose your policy — then keep it monitored
Once you pick a policy, upload the new documents and any future notices or endorsements. We help you stay on top of changes all year.
8) Feel confident again
When you understand what you’re buying, you’re in control — and you can choose coverage that matches your life today.
About Premium Increases
Premiums are on most of our minds when renewal season arrives. It’s completely normal to feel frustrated by yearly increases — especially if you’re in a lower-risk area, haven’t had losses, or you’re paying for coverages you don’t truly need.
One important thing to know: a premium increase isn’t always tied directly to your neighborhood or your business location. Rates can rise because of broader market pressures such as higher repair/rebuild costs, reinsurance costs, and rising litigation/claims expenses. In many states, premiums can also be influenced by policy-specific rating factors, which may include characteristics of the property/business and (where legally allowed) credit-based insurance scores.
This overview helps you understand whether your increase is mainly market-driven (system-wide) or specific to your policy — so you know what questions to ask at renewal time.
Unwarranted Premium Increases in Non-Environmental Risk Zones
Why Your Premiums Are Rising: Evidence of Structural Issues
1. Regulatory Friction (The “Cross-Subsidy”)
- The Issue: When Insurers cannot raise rates easily in strict states (like California), they hike rates in deregulated, low-risk states to compensate.
- The Proof: Federal Reserve Board: Pricing of Climate Risk Insurance (PDF)
2. The Reinsurance Shock
- The Issue: The cost of “insurance for insurance companies” has skyrocketed globally. Insurers pass this cost to all policyholders, even in safe ZIP codes.
- The Proof: NBER: Disaster Risk and Rising Home Insurance Premiums (2024)
3. Social Inflation (The “Tort Tax”)
- The Issue: “Nuclear verdicts” and frequent lawsuits drive up costs nationwide. Policyholders in stable states effectively pay for litigation happening elsewhere.
- The Proof: NAIC: Pausing the Social Inflation Argument (PDF)
4. Credit Scoring Penalties
- The Issue: Credit scores often dictate premiums more than actual property risk. This disproportionately penalizes low-income homeowners despite identical home safety.
- The Proof: FTC: Credit-Based Insurance Scores (PDF) & Missouri Dept. of Insurance Report (PDF)
5. The Deregulation Trap (Illinois & Utah)
- The Issue: Without “prior approval” laws, insurers hike rates to price in future fear rather than past losses. For example, Utah premiums jumped nearly 50% in just two years.
- The Proof: Illinois Dept. of Insurance Annual Report (PDF) & Utah Insurance Dept. Market Report (PDF)
Depending on the type of insurance, this chart will help you understand where rates are rising the fastest.
Premium Increases by Category ranked by inflation severity
🔴 CRITICAL (>15% Increase): Crisis-level inflation; aggressive shopping required.
🟠 HIGH (8%–15% Increase): Significant pain; check deductibles.
🟡 MODERATE (2%–7% Increase): Standard inflation; usually not worth moving if coverage is good.
🟢 STABLE / DECREASING (<2% Increase): Buyer’s market; you can likely negotiate better terms.
| Insurance Type | 2024 Rate | 2025 Forecast | Trend / Notes | Source |
| PROPERTY & HOME | ||||
| 🔴 Homeowners | +18.8% | +9% to +21% | Crisis in disaster states (TX, CA, FL, CO). Deductibles up 24%. | Matic, USI |
| 🔴 Mobile / Manufactured Home | +18.8% | +9.3% | Tracks closely with standard homeowners but with fewer carrier options. | Matic |
| 🔴 Flood Insurance | +10–15% | +15%+ | NFIP “Risk Rating 2.0” is phasing in massive hikes for coastal zones. | FEMA / NFIP |
| 🟠 Condo (HO-6) | +10–20% | +10% | Driven by “Master Policy” cost explosions passed to unit owners. | Assoc. Reports |
| 🟠 Landlord (Dwelling Fire) | +12% | +8–10% | “Social inflation” (liability suits) is driving this higher than standard home. | AM Best |
| 🟡 Renters | ~+2% | +1–3% | Remains stable/cheap as it covers contents/liability only (no structure). | III |
| AUTO & VEHICLES | ||||
| 🔴 Personal Auto | +16.5% | +7.5% | Cooling down from the massive 2023–2024 spikes. | J.D. Power |
| 🟠 Commercial Auto | +10% | +8.8% | Nuclear verdicts continue to hammer commercial fleets. | Marsh |
| 🟡 Motorcycle / RV / Boat | +5–8% | +5% | Discretionary lines are seeing moderate inflation, mostly due to parts cost. | Niche Reports |
| COMMERCIAL & BUSINESS | ||||
| 🔴 Comm. Umbrella (Real Estate) | +20–50% | +15% | The hardest hit sector. Large habitational (apartment) risks are in crisis. | Gallagher |
| 🟡 General Liability | +4% | +3.9% | Stabilizing after years of increases. | Marsh |
| 🟡 Comm. Property | +8% | +3.8% | Much better than 2023. Non-catastrophe zones are flat. | Aon |
| 🟢 Cyber Liability | -2% | -3% | Price Drop. Capacity is flooding back into the market. | Marsh |
| 🟢 D&O (Directors & Officers) | -5% | -3% to -5% | Price Drop. A true “Buyer’s Market” for corporate liability. | Gallagher |
| 🟢 Workers’ Compensation | -1.5% | -1.8% | Price Drop. The most profitable/stable line for carriers. | NCCI |
| 🟢 Surety Bonds | Flat | Flat | Rates are stable; capacity is growing with infrastructure spending. | Aon |
| LIFE & NICHE | ||||
| 🔴 Long-Term Care (LTC) | +28% | +10–20% | Carriers are aggressively hiking rates on old blocks of business. | Morningstar |
| 🔴 Pet Insurance | +21% | +15–20% | Vet cost inflation (~11%) + increased usage is driving premiums up fast. | NAPHIA |
| 🟠 Identity Theft | N/A | +10% | Fraud attempts expected to rise 49% in 2025; costs will follow. | NICB |
| 🟡 Travel Insurance | +5% | +7% | Premium increases are tied to higher trip costs, not rate hikes. | Squaremouth |
| 🟢 Term Life | Flat | Flat/-1% | Rates are stable; competition is high. | LIMRA |
| 🟢 Disability Income | Flat | Flat | Pricing remains stable (~1-3% of salary). | Gen Re |
Learn About Claim Denials
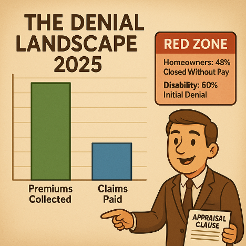
The Scale of Denials
If your insurer sends you an exclusion notice that you miss reading completely, you are continuing to pay premiums for coverage that has changed without your consent.
Below is the aggregated data from 2023-2024 using:
- Government filings (NAIC)
- Independent rating agencies (Weiss Ratings)
- Industry Market Reports (Fitch, J.D. Power).
This document is designed to be a reference guide.
It validates what you may be feeling: getting a fair payout is harder than ever.
References & Verified Sources used throughout the following denial index:
- Homeowner Denial Rates: Weiss Ratings, “14 Large U.S. Insurers Closed Nearly Half of Homeowner Claims with No Payment in 2024” (June 2025). Source Link
- Auto Denial Trends: MoneyGeek Analysis, “Auto Insurance Complaints & Denials 2024”. Source Link
- Disability Denial Rates: Bross & Frankel, “Why Long-Term Disability Claims Get Denied” (Oct 2025). Source Link
- Cyber Insurance Denials: Fitch Ratings / ASi Networks, “Why Cyber Insurance Claims Get Denied 2025”. Source Link
- Workers Comp Statistics: DaisyBill, “CA Payment Denial Rates 2024”. Source Link
I. The Denial Index
Note: “Denial Rate” includes claims closed without payment (CWOP) and formal denials. “Trend” indicates the 12-month trajectory of denial difficulty.
A. Personal Property & Vehicle (The “High Volume” Denials) Theft and accident claims are increasingly managed by AI, leading to lowball offers or “pre-textual” denials.
| # | Insurance Type | Est. Denial CWOP Rate | Primary Denial Tactic | Trend |
| 1 | Personal Auto | 17.8% | Valuation Disputes (“Total Loss” Software) | ⬆️ Worsening |
| 2 | Motorcycle | ~20% | “Reckless Operation” Exclusions | ➡ Stable |
| 3 | RV / Motorhome | 15-18% | Water Intrusion / Maintenance Exclusions | ⬆️ Worsening |
| 4 | Boat / Watercraft | 12-15% | “Lay-up Period” Violations | ➡ Stable |
| 5 | Classic Car | 10% | “Daily Use” & Valuation Gaps | ➡ Stable |
| 6 | Homeowners | 48% (Some Carriers) | Wear & Tear vs. Storm Damage | ⬆️ CRITICAL |
| 7 | Renters | 14% | Lack of Proof of Ownership (Receipts) | ➡ Stable |
| 8 | Condo (HO-6) | 22% | “Master Policy” Finger-Pointing | ⬆️ Worsening |
| 9 | Landlord / Dwelling | 25% | “Vacancy” Clauses (>30 Days) | ⬆️ Worsening |
| 10 | Mobile Home | 30% | Pre-existing Condition / Maintenance | ➡ Stable |
| 11 | Flood (Private) | Varies | “Earth Movement” Exclusions | ⬆️ Worsening |
| 12 | Earthquake | High Deductible | % Deductibles wipe out most claims | ➡ Stable |
| 13 | Umbrella (Personal) | <5% | Underlying Limits Not Met | ➡ Stable |
B. Life, & Income Protection (The “High Stakes” Denials) Insurers use medical investigations to void policies entirely during the “Contestability Period.”
| # | Insurance Type | Estimated Denial Rate | Primary Denial Tactic | Trend |
| 14 | Term Life | 10-20% | Material Misrepresentation (Health History) | ⬆️ Worsening |
| 15 | Whole Life | 10-20% | Lapse in Premium / Cash Value Disputes | ➡ Stable |
| 16 | Universal Life | 15% | “Cost of Insurance” Spikes | ⬆️ Worsening |
| 17 | Disability (Short-Term) | 20-30% | Lack of “Objective Medical Evidence” | ⬆️ Worsening |
| 18 | Disability (Long-Term) | 40-60% | “Any Occupation” Definition Shift | ⬆️ CRITICAL |
| 19 | Long-Term Care | ~25% | ADL Definitions (Need 2 of 6) | ⬆️ Worsening |
| 20 | Pet Insurance | 15-20% | “Pre-existing Condition” Lookbacks | ⬆️ Worsening |
| 21 | Travel Insurance | 20-30% | “Foreseeable Event” Exclusions | ⬆️ Worsening |
C. Commercial & Specialty (The “Complex” Denials) Business claims are often fought with legal technicalities and “concurrent causation” clauses.
| # | Insurance Type | Est. Denial Rate | Primary Denial Tactic | Trend |
| 22 | Comm. Gen. Liability | 10-15% | “Expected or Intended Injury” Exclusion | ➡ Stable |
| 23 | Commercial Property | 20-30% | Protective Safeguards (Alarm Failure) | ⬆️ Worsening |
| 24 | Workers Comp | 15-37% | “Course and Scope” of Employment | ⬆️ Worsening |
| 25 | Commercial Auto | 20% | Driver Eligibility / Non-Listed Driver | ➡ Stable |
| 26 | Prof. Liability (E&O) | Varies | Late Reporting / “Prior Acts” Date | ➡ Stable |
| 27 | Directors & Officers | Complex | “Insured vs. Insured” Exclusion | ➡ Stable |
| 28 | Cyber Liability | 24-40% | Failure to Maintain MFA / Security | ⬆️ CRITICAL |
| 29 | Product Liability | 15% | “Your Product” Exclusion (Recall Costs) | ➡ Stable |
| 30 | Business Interruption | Very High | Physical Damage Requirement (No Virus) | ➡ Stable |
| 31 | Key Person | 10% | Suicide / Fraud Exclusions | ➡ Stable |
| 32 | Title Insurance | 5-8% | Exclusions for Known Defects | ➡ Stable |
| 33 | Event / Wedding | 15-25% | “Change of Heart” (Not covered) | ➡ Stable |
II. The Mechanics of Denial:
It is not just bad luck; it is a system. Industry reports from firms like McKinsey & Company have historically advised insurers on how to reduce “claims leakage” (money paid out).
McKinsey & Co Tactics: Sussman & Simcox, “Delay, Deny, Defend: The McKinsey Model”. Source Link
1. The “Delay, Deny, Defend” Strategy
This model, highlighted in legal critiques of the industry, uses time as a weapon:
- Delay: Requesting redundant documents (e.g., asking for 5 years of tax returns for a 3-month disability claim) to induce “claimant fatigue.”
- Deny: issuing a denial based on a strict computer algorithm, forcing the consumer to appeal. Statistics show <1% of consumers appeal denials, making this a profitable filter.
- Defend: For the few who fight, the insurer uses their vast legal resources to force a settlement for pennies on the dollar.
2. Algorithmic Claims Processing (The “Touchless” Denial) Insurers utilize software from vendors like CCC Intelligent Solutions or Mitchell International.:
- How it works: The software automatically calculates the value of a loss.
- The Flaw: Investigations suggest these programs are tuned to “round down.” For example, in auto total losses, they often select “comparable” vehicles that are in worse condition than yours to lower the baseline value.
3. The “Cyber” Trap: The MFA Loophole In 2024, Cyber Insurance denials spiked to nearly 40%:
- The Tactic: Insurers now require “Multi-Factor Authentication” (MFA) on all accounts. If you are hacked and they find one old admin account that didn’t have MFA enabled, they can deny the entire claim, arguing you failed to meet the “Security Maintenance” warranty in the contract.
III. Trigger Words & How to Contest Them
When you receive a letter, scan it for these specific terms. They are the code words for “We don’t want to pay.”
A. Property & Auto
- Trigger Word:“Betterment”
- Meaning: “The new part we used made your car/house better, so you pay the difference.”
- Contest It: Demand they prove the specific increase in Resale Value caused by that part. Often, they cannot.
- Trigger Word:“Wear and Tear”
- Meaning: “Your roof leaked because it was old, not because of the storm.”
- Contest It: Provide a “Weather History Report” (from NOAA data) showing wind speeds at your address on the date of loss to prove the storm was the proximate cause.
B. Disability & LTC
- Trigger Word:“Subjective Symptoms”
- Meaning: “Pain/Fatigue isn’t visible on an MRI, so it doesn’t exist.”
- Contest It: Submit a “Functional Capacity Evaluation” (FCE). This is a physical test that measures exactly what you can and cannot do, providing objective data to counter their claim.
- Trigger Word:“Mental/Nervous Limitation”
- Meaning: “We are reclassifying your physical illness (like Lyme or Fibromyalgia) as depression to cap benefits at 24 months.”
- Contest It: Ensure your doctor explicitly documents the physical origin of the symptoms in every visit note.
C. Commercial
- Trigger Word:“Protective Safeguards Endorsement”
- Meaning: “Your sprinkler/alarm wasn’t on/inspected, so we deny the fire claim.”
- Contest It: Provide logs showing the system was operational or that the failure was beyond your control (e.g., power outage).
A real example: when a premium jumps — and you don’t see it coming

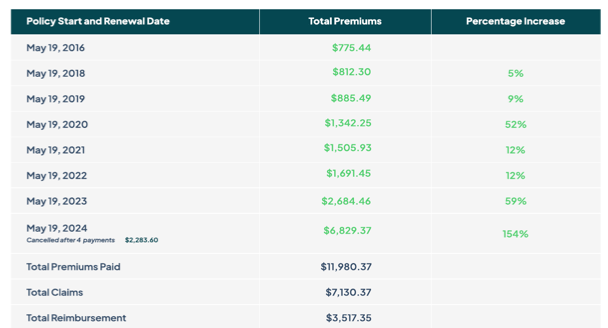
Maya’s owner thought he was covered… until a notice slipped by. Maya’s owner didn’t realize anything had changed until he used My Policy Advocate™ to review his pet insurance documents. A key notice arrived by paper mail and was easy to miss.
When he reviewed the policy details—including endorsements, exclusions, and premium notices, he found an unusually steep increase:
- Annual premium: $2,686 → $6,829
- Increase: 154%
- Reason given: Maya turning nine (age-based pricing)
Shocked, he called the insurer to confirm the change and requested a full claims history. He felt blindsided—because Maya was healthy and nothing about her age suggested a spike like that.
Takeaway: Premium increases aren’t always driven by claims. Pricing can shift for reasons you may not expect, and important notices can arrive in ways that are easy to overlook. If it happened to him, it can happen to anyone.
Maya is now 10 and healthy. She’s been to the vet only once in the past year for a checkup and vaccines ($650). After seeing the new premium, her owner canceled the policy and avoided nearly $6,000 in additional premiums for coverage that no longer felt fair or worthwhile.
Why this matters: My Policy Advocate™ helps you spot important changes before renewal shock hits—by keeping policy documents and notices in one place so you can see what changed and decide what to do next. Listen: How Pet Insurance Works